Bad Apple!! is a Touhou song whose music video has been described as “the doom of music videos”, because it’s been played on everything from string lights to oscilloscopes. This post is about that video, writing an improved “video player” for Task Manager’s CPU graphs, and using virtual machines to push my feeble hardware to the limit.
Prior art
The idea started in March, with a video that appeared to play it on an AMD 3990X, but that one turned out to be “fake”, at least in the sense that it relied heavily on video editing. More recently, @kbeckmann and @winocm played it over 64 and 128 processors, which at first inspired me to replicate what they did, and pretty soon I wanted to bring something new to the table.
The biggest obstacle for me was hardware. The “shaded tiles” style of CPU graphs only kick in when you have 64 or more processors, but my main machine only has eightish, and my laptop only has twelvish. There’s a whole spectrum of approaches I could choose from:
- Using video editing to render an imitation (already done)
- Modifying taskmgr’s memory to feed it fake activity numbers
- Using a virtual machine to Download More Cores
- Just recording it on real hardware (already done)
I’m really into virtualisation, so I decided to solve this with libvirt and KVM. While I could probably ask Igalia to let me run a guest on one of their 128-thread build boxes, I was interested in a challenge, driven by the same urge as when I built a home router out of an old Pentium III1. That turned out to be challenging and interesting, and I’m surprised I was able to mitigate enough of the problems that the result was worth sharing.
Getting started
My main Windows install is a libvirt guest with GPU passthrough, so at first I tried the path of least resistance. I cranked up the CPU topology, rebooted, and… it struggled, taking several minutes to reach the login screen.
I figured that such an extreme overcommitment might be fine after boot, and the only problem was booting that way, so I tried CPU hotplug, but nothing happened. While Windows Server apparently got an update that fixed hotplug, and Windows 10 also received that update, that didn’t mean that Windows 10 supports hotplug.

I put together a Windows Server 2019 guest, and at last I could use CPU hotplug! But the guest also booted fine with the overcommitment in place (or at least it does now, if I’ve got my timeline wrong). Perhaps the sheer lack of crap it had to load, by virtue of being a fresh install and Windows Server, did the trick.
I turned off the malware scanner for good measure.
The black screen phase
My video player has its roots in @kbeckmann’s bad_cpu.py, so let’s start there. The latter spawns a process for each “pixel” of the CPU graph, each of which sets its affinity to one CPU, then spins and sleeps as a kind of pulse-width modulation over CPU activity, just like a microwave or (some types of) dimmer switch.
Sadly bad_cpu.py doesn’t scale beyond 64 processors without modifications, because of how the Windows API communicates affinity. Since the dawn of time, affinity has been represented as a register-width bit mask. Windows is big on backwards compatibility, so when support for more than 64 (or 32) processors was introduced, the developers introduced the concept of processor groups.
The library we were using didn’t provide a way to change processor group affinity, Python’s bindings for the Windows API didn’t include SetThreadGroupAffinity, and even if it did, what if the interpreter creates other threads than the one GetCurrentThread would give us a handle for?
That’s when I decided to Rewrite It In Rust. As far as Windows was concerned, this initially involved three things:
- GetLogicalProcessorInformationEx to find out what the processor groups are
- InitializeProcThreadAttributeList and UpdateProcThreadAttribute to wrap each processor group affinity value in some fancy paper and a bow
- CreateRemoteThreadEx to create each pixel thread with its affinity value
I struggled with steps one and two for most of Friday.
GetLogicalProcessorInformationEx is named after GetLogicalProcessorInformation, a similar function that doesn’t support processor groups. The latter had an example, from which I learned that it writes an array of fixed-size structures, so I assumed that this was also true for the former, but when I tried calling the function, I got nonsense. It wasn’t until I found this usage in the wild that I learned the newer function writes an array of variable-size structures!
While it was clear that our affinity values had to outlive the attribute lists that wrapped them, it was unclear whether the attribute lists had to outlive the threads they were used to create. I eventually tried to do both, but I don’t think my approach guaranteed that they wouldn’t move. I couldn’t figure out how to Pin them, nor was I even sure whether that was the appropriate tool.


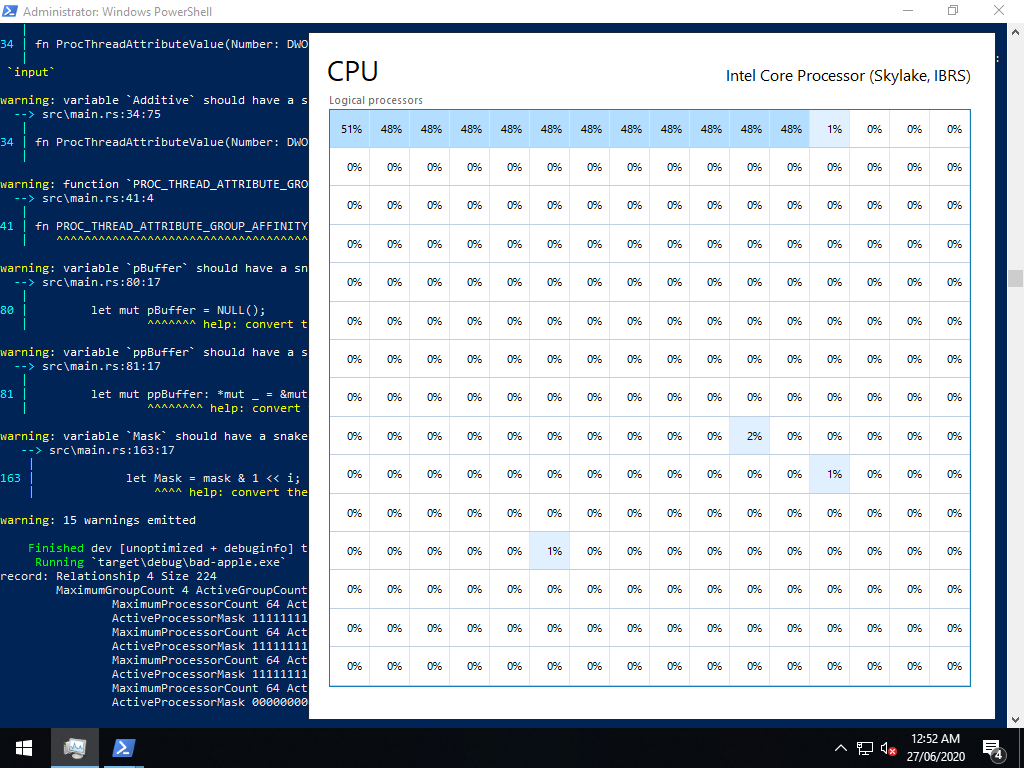
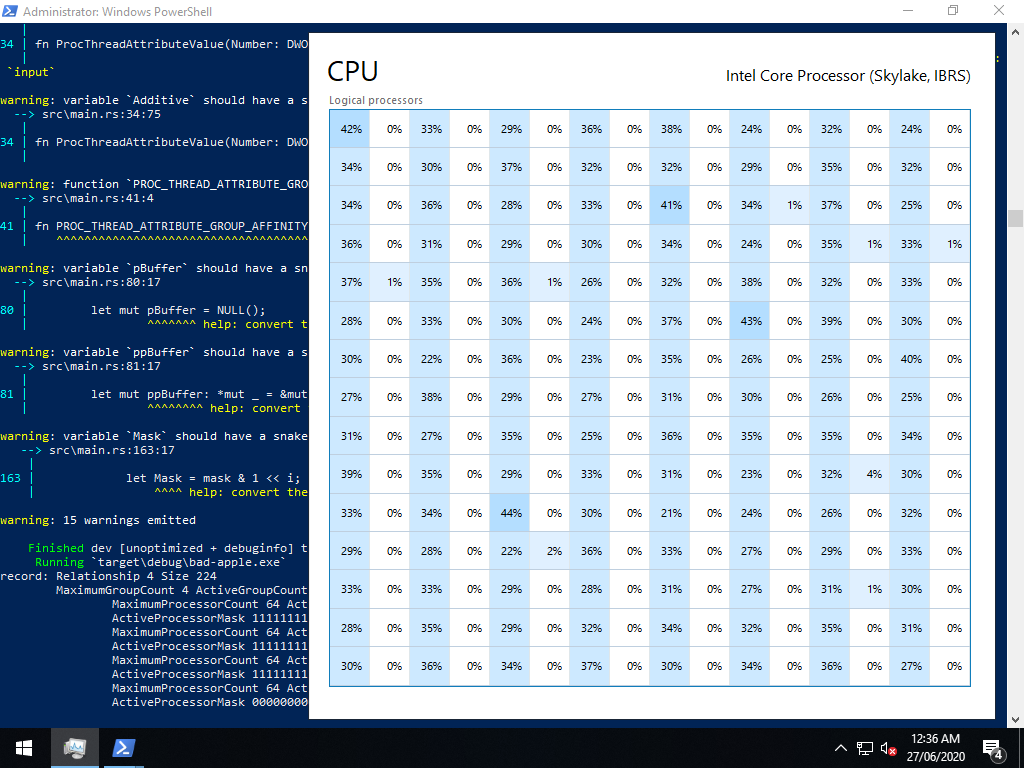
By the end of Friday, I got some test patterns going, but I was disappointed to see that the percentages were distorted downwards, making pixels too light, when too many pixels needed to be dark. Migrating the virtual machine to my laptop helped, but not enough.
From there, implementing external video input was easy, probably the easiest part of the project. Slurp up the file, throw in a couple of loops with Rust’s wonderful ChunksExact, and dole out each pixel to the appropriate vector.
Performance tuning
Having seen disappointing results from both bad_cpu.py and my new player, at first I looked beyond the code for solutions. The ideas I came up with fell into three buckets:
- Messing around with schedulers, be it on the guest (α β γ δ) or the host (ε). I didn’t know enough to come up with informed ideas, so I didn’t get very far.
- Optimising the virtual machine, based on the same advice that I heed from the VFIO community and their resources. libvirt’s defaults are generally top notch, but it still leaves room for tweaks like switching to 1 GiB static huge pages and removing the memory balloon. That said, nothing had an effect to write home about.
- Pinning the guest threads, which I’ve pulled into its own dot point because it did have a notable effect. Massive and negative. This is a common tweak for normal guests that aren’t oversubscribed, but here? The guest performance tanked like it did when I tried to overcommit my main install, and CPU hotplug just delayed the tanking. Even without nohz_full (which I later learned was a silly idea when overcommitting pins). Even without rcu_nocbs. Even without isolcpus or cset shield.
I also ran into a bunch of limits while figuring out how far I could push my hardware.
- 32 (KAFFINITY on i686-pc-windows-gnu, rustup’s reasonable default)
- 64 (KAFFINITY on x86_64-pc-windows-msvc, which I switched to)
- 255 (pc-q35-4.2 without iommu@eim)
- 288 (pc-q35-4.2 with iommu@eim)
- 64 sockets (Windows limitation?)
To go beyond 255 logical processors and reach the 288 limit, we needed iommu@eim, which also needed iommu@intremap and the qemu ioapic.
<domain>
  <features>
    <ioapic driver="qemu"/>
  </features>
  <devices>
    <iommu model="intel">
      <driver intremap="on" eim="on"/>
    </iommu>
  </devices>
</domain>
For what it’s worth, by the time I recorded the video, I ended up with this configuration.
High Frame Rate™
Task Manager has a bunch of update speeds, but the fastest is only twice a second. The good news is that we can also press F5 to update as often as we want. Once I added a thread that calls SendInput after every frame, we could play the video at 4 fps.
Well… kind of. SendInput can only press F5 in the foreground window, so I had to Alt+Tab every time I ran the program. SendMessage would probably be better, but I later worked around that with FindWindowW and SetForegroundWindow.

From here on, I turn off automatic updates, because they split our carefully timed refresh cycles into two corrupted updates.
Making the player press F5 between frames also ensures that Task Manager’s cycles are in phase with the frames (albeit with a small error between F5 and refresh). This might not seem like a problem at first, much like the number of days from X January to X February is always the number of days in January, but when we’re too far out of phase, the dark pixel in a dark-to-light transition won’t be dark enough (and vice versa).
There are limits to this technique. The higher the frame rate, the more of our CPU time gets consumed by Task Manager, until the tiles become wildly inaccurate.
Timing is everything
By this point, I was noticing more and more severe timing problems. The simple approach taken by bad_cpu.py was perfect for real hardware, but on an overcommitted virtual machine, that didn’t cut it. There was excessive visual noise, and when I started playing the original video side-by-side on another machine, I noticed that our playback finished around 30 seconds late.
My first thought was that Instant, despite being monotonic, is “not guaranteed to be steady”, such that “some seconds may be longer than others”. But on Windows, it’s based on QueryPerformanceCounter, which provides much stricter guarantees. QPC uses the best available counter on a given machine (e.g. RDTSC, RDTSCP, HPET, ACPI PM timer) plus its own magic2 to create timestamps unaffected by system time, dynamic frequency scaling, multiple processors, and hypervisor conditions (assuming a reasonable hypervisor). These timestamps are even meaningful across threads (± 1 tick)!
I then worried that our F5 thread was getting delayed by all of the busier pixel threads. I didn’t measure this one, and I doubt it was a huge problem unless we’re on a frame that’s almost completely filled, but I used SetThreadPriority to keep the pixel threads out of the way. I would have preferred to set the threads’ priorities at creation time with something like a ProcThreadAttributeList, but that didn’t seem to be possible. THREAD_MODE_BACKGROUND_BEGIN looked attractive, but upon closer inspection, that’s an orthogonal setting for “resource” (I/O) scheduling, which we never do during playback, so I chose THREAD_PRIORITY_IDLE.
One of the biggest problems turned out to be keeping the pixel threads in sync.
Each pixel thread started its playback as soon as it could execute.
I used an AtomicUsize with fetch_add(1, Relaxed) to measure the time from right before the first CreateRemoteThreadEx to the start of the last pixel thread to gain execution, and it was a massive 150–250 milliseconds!
I struggled to imagine which of Windows’ synchronisation primitives would be an efficient solution here, but Rust came to the rescue with Barrier, which blocks waiters until a given number of waiters are waiting.
That number is one for every pixel thread plus one for the F5 thread, and I added waits to the start of both functions’ main loops.
With all of the threads in sync, I eliminated the sleeps from the pixel threads, elevating the importance of the F5 thread to what I’ve since called the “clock” thread. The pixel threads’ main loop was wait → spin → sleep, but the clock thread was wait → sleep → F5, so skipping directly to the wait was effectively a sleep.
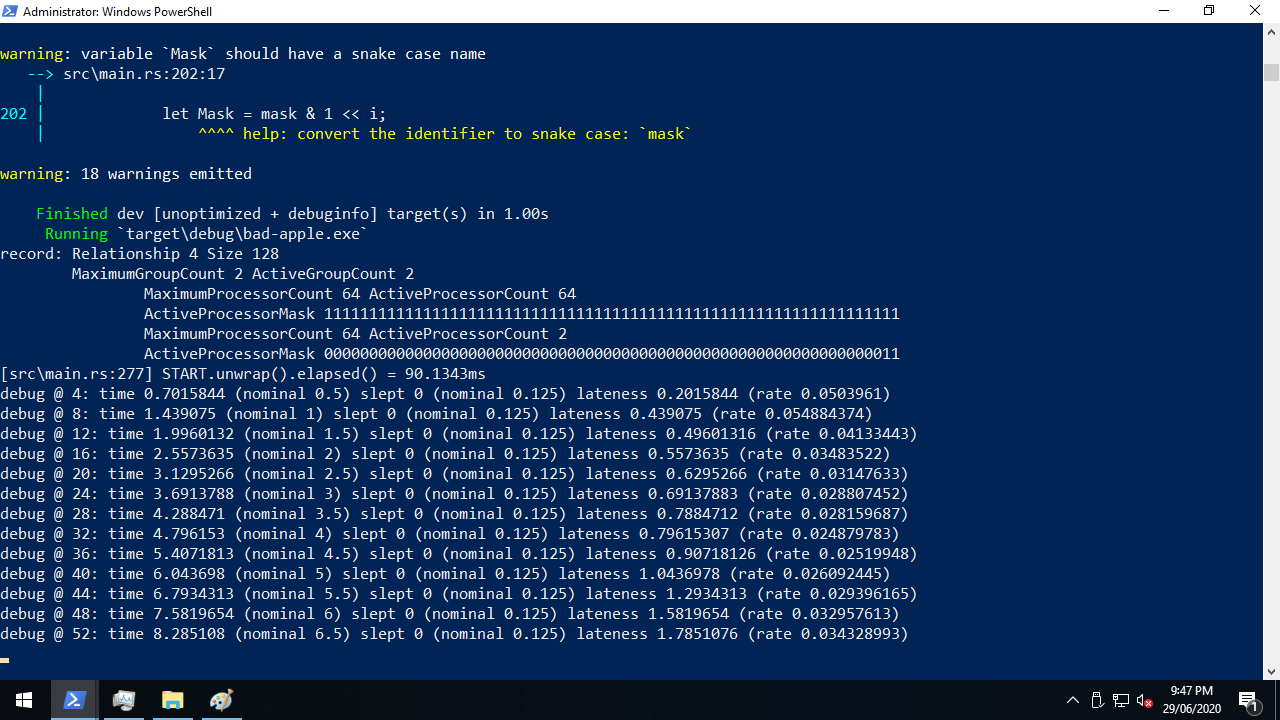
This improved the picture quality, but playback still consistently finished too late. Given the simple algorithm “spin for darkness / fps, sleep for (1 − darkness) / fps”, this kind of problem is always present (if negligible) even on real hardware. Calculating how long to sleep for is very fast but not instant, and sleeping for some amount of time doesn’t guarantee that the scheduler will return us to execution in that time.
The first thing I tried was to adjust the sleep time to catch up with (or if necessary, wait for) the nominal time we should start the next frame, based on when playback started. I called the difference between what a naïve sleep would give us and the nominal time lateness. This helped at very low resolutions where I disabled most of the pixels on the canvas, but what I otherwise found was that our adjusted sleep was always zero.
This was actually bad news and good news at the same time. The bad news was that we would need to do more to fix our timing problems, but the good news? Even when we effectively removed sleeps, the picture was still recognisable, and if anything, the change helped us with our “washed out” distortion. I was worried that this might not be the case, because if you look at each pixel thread in isolation and ignore the Barrier, wouldn’t all spin and no sleep yield 100% activity?
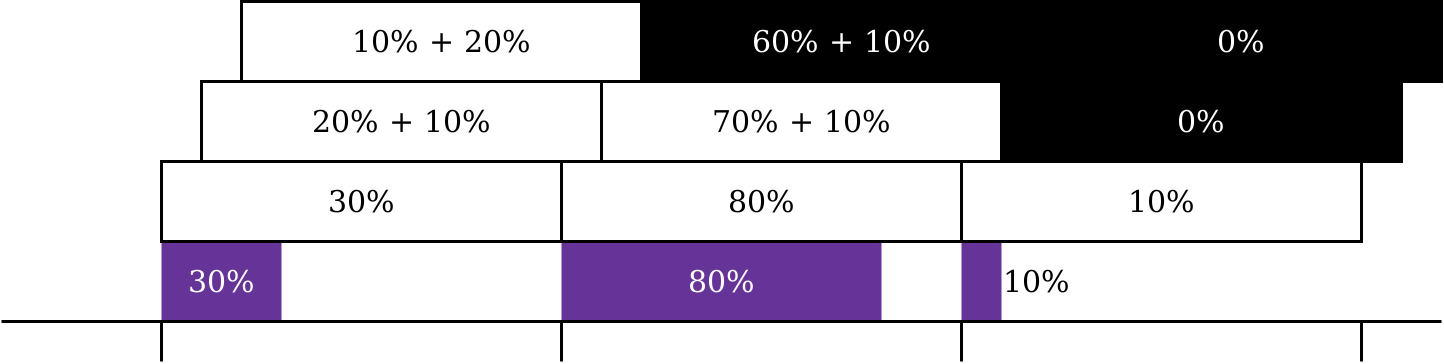
I now believe — but correct me if I’m wrong — the percentages are based on how much of each wall second (or other period) a given processor is busy for, and when a guest processor is preempted against its will, that time doesn’t count, like how you don’t experience the time you’re asleep3. This would explain the distortion that occurs when a guest processor can’t run because the host processors are contended!
One thing that I was surprised to see made zero difference was switching from a debug build to a release build.
It ended up being so irrelevant to this workload that while I put --release in the README, I forgot to use it when recording the video!
But the technique that made the biggest difference to our timing problems was dropping frames. When we’re running more than 1 / fps late, not even a 100% empty frame gives us enough room for sleep adjustment that we’ll catch up completely by the end of the frame. Figuring out how the clock thread could safely communicate this to the pixel threads was difficult, but I decided to publish the next frame index with a RwLock, which I would describe as Rust’s borrowing rule plus the ability to wait.
Strictly speaking that wasn’t enough, because while the Barrier syncs up all of the threads at the start of each frame, we have no way of knowing when the write acquisition (clock thread) happens relative to the read acquisitions (pixel threads). Did it happen before all of them, after all of them, or somewhere in between? Either of the first two would probably be fine if only we could make it consistent, but somewhere in between is very bad. If that happens, some pixels will draw their part of the old frame and others the new frame, which sounds like the relatively minor problem known as horizontal tearing… until you realise that the read acquisitions don’t happen in scanline order.
To prevent that, I added a second wait on the Barrier to both functions’ main loops, dividing each frame into two phases based on the next frame index: read-only and write-only. In the read-only phase, all threads read that variable (and do the rest of their work), then in the write-only phase, the clock thread writes the new index. I’m sure there are better tools for the job though — it relies on me writing code that obeys my own rule, without any compile-time or runtime enforcement.
The present tense
I wrote a video player for taskmgr, and it now works well enough to play Bad Apple!! on an 11x6 canvas with only a laptop and the power of virtualisation. Picture fidelity and frame rates are far better during the black-on-white shots, but at least some of the white-on-black shots managed to yield more than a complete blur.
Playback at 4 fps or even 10 fps is now possible, which is an improvement that even the Real Hardware folks can enjoy, but if I could drive 66 pixels with only 12 hardware threads, imagine what we could do with 64 or even 128!
-
I still use that router at home today, almost five years later, and I’m only planning to decommission it because I recently upgraded to gigabit internet, which the poor thing just can’t keep up with. ↩
-
This includes workarounds for lying firmware, handling of unsynchronised TSC values across processors, and much more. I would seriously recommend reading Microsoft’s documentation about this, it’s very interesting! ↩
-
I don’t think this is actually true, but I’m sticking with the analogy. ↩